A:M: Debugging a plugin
This tutorial is a translation of Steffen Gross's tutorial "Debuggen eines Plugins" which can be found here.
In this mini tutorial I want to show you how to debug a plugin for A:M.
This only works from A:M 9.5n upwards only with dongled versions, since there was a change in the copy protection of the software. (Comment by translator: I do not think this is true anymore)
First you need to start A:M from Visual Studio pressing CTRL + F5 (or using the exclamation mark in the symbol menu).
This is necessary because otherwise the copy protection will prevent you from debugging.
First, please select the program for a debug session.

Image: Executeable programm for debugging
After starting the program with OK, a task switch to A:M will follow which is not yet useful for us. Bring Visual Studio back to focus because we will do a little trick now :-).
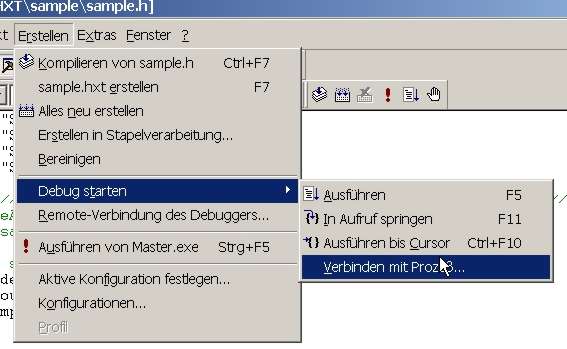
Image: Start debugging > Connect with process
Now we connect the debugger using "Connect to process" with A:M.
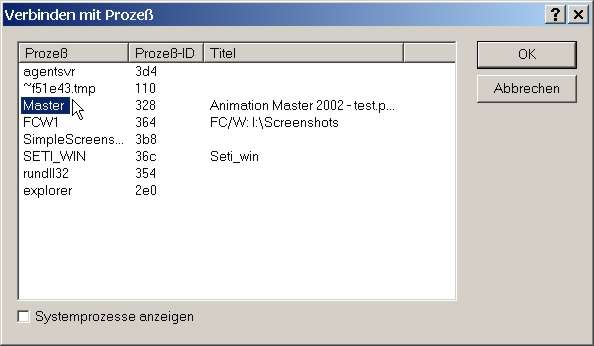
Image: Connect to process
We have overcome the copy protection now. After bringing Visual Studio back to focus we can load in the necessary source code of SampleProject because we do not want to debug at assembler level right?
Now open the file Sample.cpp using File > Open into the workspace.
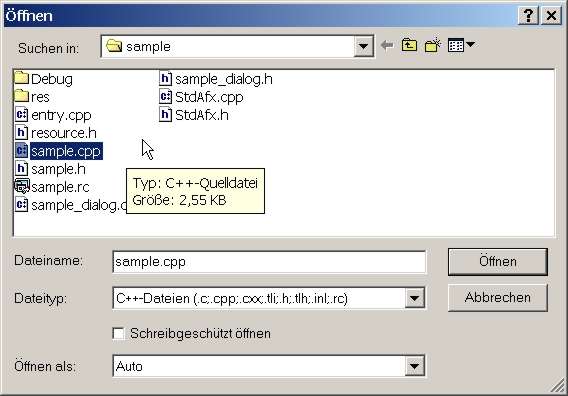
Image: Open C++ file
And now we can easily put in break points / hold points since the plugin does not do anything.
Put in the following: "if (dlg.DoModal()!=IDOK)"
by inserting a break point.
Now bring A:M back to front and open up the plugin.
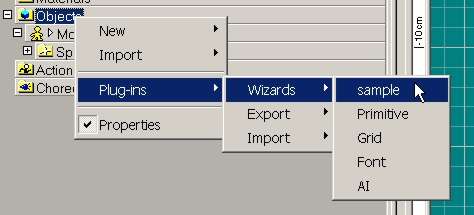
Image: In A:M, right-click on Objects in the PWS and choose "Plugins > Wizards > sample"
And there we are: After opening this we are in the debugger.
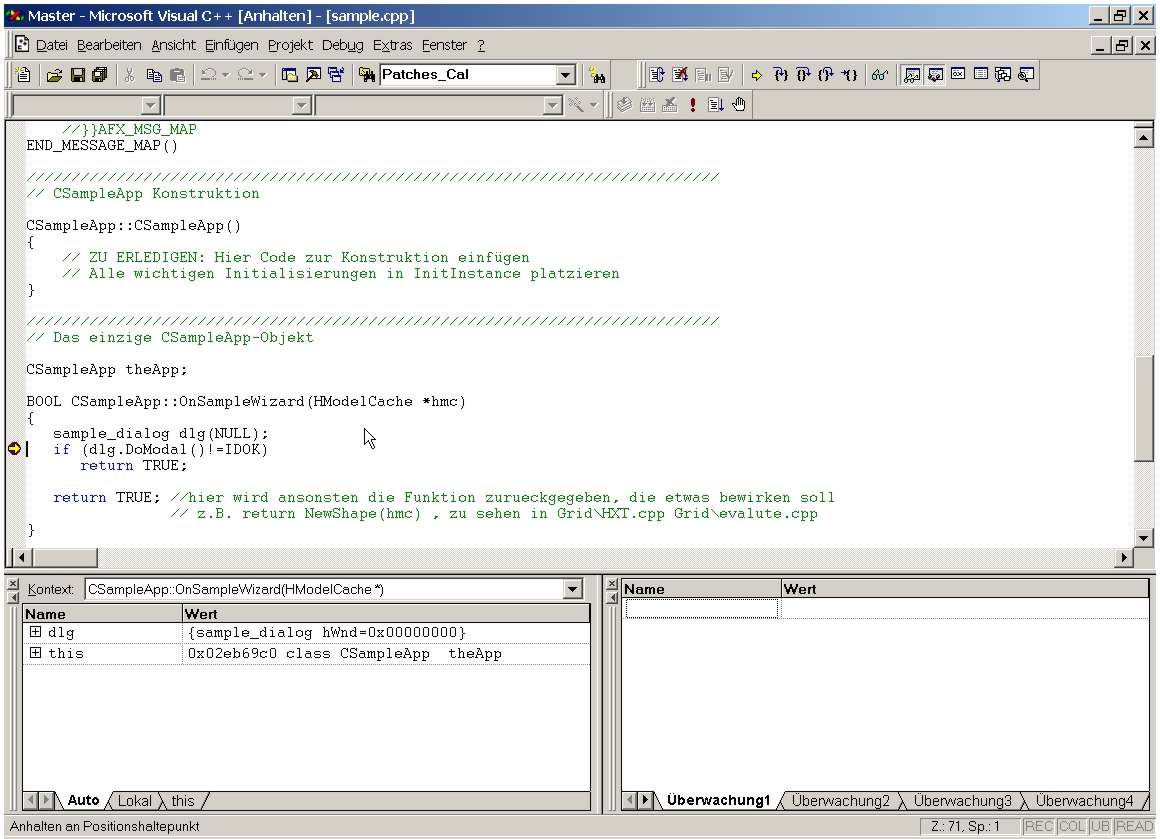
Image: Visual Studio Debugger at Breakpoint (waiting)
To continue the prorgramm just hit "F5".
And now: Happy Debugging! :)

